

SEC filings and earnings reports provide the financial, operating, product, and market figures for Beyond Meat, Inc. (BYND) moved from rapid IPO-era growth to lower revenue, recurring losses, and a prolonged reset. Fiscal 2024 net revenue was $326.5 million, below the company’s $464.7 million peak in 2021.
Below, you can compare annual results, channel exposure, products, partnerships, stock context, and the risks that matter before relying on older growth figures.
Beyond Meat Grew From a Startup Into a Public Brand
That revenue decline began after a period of unusually fast expansion. Ethan Brown founded Beyond Meat in Los Angeles in 2009 to develop plant-derived products designed to mimic the taste, texture, appearance, and cooking behavior of animal meat.
The company built its identity around a familiar food format rather than an unfamiliar ingredient. Beyond Meat, Inc. uses pea protein, oils, flavor systems, and color ingredients to produce burgers, sausage, ground-beef alternatives, and chicken-style products without animal protein.
Beyond Meat statistics from the early years show why the company drew attention outside the plant-based aisle. A refrigerated grocery placement made the products easier for shoppers to compare with conventional meat, while restaurant partnerships gave the brand wider visibility.
Key Dates Mark the Company’s Expansion
- 2009 founding: Ethan Brown started Beyond Meat in Los Angeles and positioned plant protein as a mainstream grocery and restaurant category.
- 2012 retail launch: Whole Foods Market carried early chicken-style products, giving the brand a national retail foothold.
- 2016 burger debut: Beyond Burger entered refrigerated meat cases, where you could find it beside conventional patties.
- May 2019 IPO: Beyond Meat listed on Nasdaq under ticker BYND at $25 per share and drew intense investor attention.
- 2019 trading surge: Shares climbed sharply after listing as restaurant partnerships and category forecasts supported expectations of rapid growth.
- 2020 revenue peak: Annual net revenue reached roughly $406.8 million as pandemic-era retail demand lifted grocery sales.
The May 2019 listing became one of the food sector’s most visible public debuts. BYND closed its first trading day at $65.75 after pricing at $25, showing that investors assigned substantial value to expected category growth rather than current earnings.
Three routes brought products to market: the U.S. retail channel, the U.S. foodservice channel, and international distributors or restaurant partners. Your interpretation of later results should account for those routes because each carries different order sizes, pricing terms, promotion costs, and margin pressure.
That early expansion created the baseline for the annual financial record. The numbers below show how far the business moved from its peak-growth assumptions.
Against that earlier benchmark, the latest filings reveal how sharply growth expectations have given way to financial strain.
Annual Results Show Revenue Pressure and Persistent Losses
Against that expansion baseline, fiscal results show a smaller business with improved direct product economics but continuing companywide losses. Beyond Meat reported $326.5 million in fiscal 2024 net revenue, down from $343.4 million in 2023 and $464.7 million in 2021.
Beyond Meat financial performance changed sharply after 2021. Net revenue fell as lower volumes and softer category demand outweighed pricing actions, while operating losses remained large even after gross margin returned to positive territory in 2024.
Annual Revenue, Margins, and Losses
| Fiscal year | Net revenue | Revenue growth | Gross margin | Operating loss | Net loss |
|---|---|---|---|---|---|
| 2020 | $406.8 million | 36.6% | 25.2% | $52.6 million | $52.7 million |
| 2021 | $464.7 million | 14.2% | 25.2% | $80.9 million | $182.1 million |
| 2022 | $418.9 million | -9.9% | -5.7% | $359.7 million | $366.1 million |
| 2023 | $343.4 million | -18.0% | -24.1% | $337.7 million | $338.8 million |
| 2024 | $326.5 million | -4.9% | 12.8% | $154.9 million | $160.9 million |
Beyond Meat revenue by year shows that 2021 remains the high point at $464.7 million. Revenue then declined by $45.8 million in 2022, by $75.5 million in 2023, and by another $16.9 million in 2024.
Fiscal 2024 brought a positive 12.8% gross margin after negative gross margins of 5.7% in 2022 and 24.1% in 2023. That improvement points to cost repair, lower inventory charges, and better production economics, but it does not show that demand returned to peak levels.
The net loss remained $160.9 million in fiscal 2024. You should treat that figure separately from gross margin because positive direct product economics still must cover corporate payroll, marketing, research, interest expense, and other operating costs.
Gross Margin Explains the Cost of Each Sale
Gross margin measures the revenue left after direct production costs. Ingredients, factory labor, freight, inventory write-downs, and plant overhead all affect this figure before selling expenses, research costs, and interest expense enter the income statement.
A negative gross margin means product revenue did not cover direct costs. For your analysis, that is a more serious signal than a modest revenue decline because every additional unit sold may still add pressure until production costs improve.
Volume also affects factory economics. Lower production leaves fixed plant costs spread across fewer pounds of finished product, which can weaken gross margin even when package prices hold steady.
A rising gross margin may reflect lower inventory charges and better plant utilization, yet it does not automatically signal stronger consumer demand. Review unit volume, net revenue, and cash use together.
Those annual figures establish the broad trend. Quarterly results show whether the reset is steady or shaped by uneven promotions, shipments, and inventory timing.
Beneath the full-year totals, shorter reporting periods expose the pace and unevenness of the company’s adjustment.
Quarterly Results Show How Fast the Reset Is Moving
Because annual figures can hide short-term swings, quarterly reporting provides the clearer operating snapshot. Beyond Meat’s fiscal fourth quarter of 2024 reported about $76.7 million in net revenue, gross margin near 5.8%, adjusted EBITDA of roughly negative $38.6 million, and net loss near $44.9 million.
A single quarter can look stronger or weaker than a full-year trend. Promotions, restaurant timing, inventory charges, and seasonal grocery activity can move quarterly results without changing the underlying demand picture.
Reported Measures Serve Different Purposes
Net revenue is money recorded after trade allowances, returns, and similar deductions. Gross margin focuses on direct product economics, while operating loss and net loss capture a broader set of company expenses.
Adjusted EBITDA removes interest, taxes, depreciation, amortization, and selected noncash or unusual charges. You can use it to assess operating pressure, but it is not the same as net income and should not replace the reported net loss.
Cash flow adds another layer. Operating cash flow tracks cash generated or used by the business, while capital spending reflects cash invested in facilities and equipment.
A loss on the income statement does not always match cash use in the same period. Inventory, payables, depreciation, and other accounting items can move at a different pace than cash, which is why you should review the cash-flow statement alongside earnings releases.
Volume and Pricing Can Move in Opposite Directions
- Unit volume: Fewer pounds shipped can reduce revenue even as shelf prices rise.
- Net pricing: Trade spending and retailer allowances can reduce realized revenue below the package price.
- Plant utilization: Lower output spreads factory labor and depreciation across fewer finished products.
- Inventory charges: Write-downs can damage gross margin as stock ages or forecasts change.
- Product mix: Restaurant formats, retail patties, and international shipments can carry different margin profiles.
Beyond Meat has cited lower pound volumes, product-mix changes, and promotional activity as forces behind revenue movement. Retailers may require promotions to maintain shelf movement, while foodservice accounts can place larger but less predictable orders around menu launches.
Reporting dates matter as well. Fiscal 2024 ended on December 31, 2024, while market-data platforms may show trailing-twelve-month figures that combine several quarterly periods.
Match each number to its earnings release or Form 10-K period before placing it beside a stock chart. That date check becomes especially important once revenue is separated across grocery, restaurants, and international distribution.
Because timing can distort headline comparisons, the composition of sales becomes essential for judging underlying exposure.
Sales Channels and Geography Explain Different Revenue Risks
That timing difference matters because grocery sales and restaurant sales do not behave like the same business. The U.S. retail channel depends on household trips, shelf placement, promotions, and repeat purchases, while the Foodservice channel can shift quickly after a chain changes a menu or ends a pilot.
Beyond Meat revenue by region also requires careful reading. The company has not always published country-level detail sufficient for a clean national ranking, so your review should avoid treating broad international figures as evidence of equal demand across every market.
Three Revenue Routes Carry Different Risks
| Route to market | Main demand driver | What to watch |
|---|---|---|
| U.S. retail | Household repeat purchases and shelf velocity | Distribution, promoted volume, and household penetration |
| U.S. foodservice | Restaurant menu placements and institutional orders | Chain launches, menu retention, and order frequency |
| International | Distributor reach and country-specific menu programs | Currency effects, local demand, and partner concentration |
The United States remains Beyond Meat’s central market. Canada, parts of Europe, the United Kingdom, and selected Asia-Pacific markets have served as meaningful distribution areas at different points, but international revenue can change with distributor orders, currency translation, and local menu programs.
McDonald’s McPlant trial activity showed both the opportunity and the risk of restaurant exposure. A major chain can introduce millions of diners to a product, but a limited menu test does not create recurring revenue unless locations retain the item and customers reorder it.
Retail takes longer to evaluate. A grocery product needs shelf space, a familiar price point, and repeat demand after the first purchase, so broad distribution alone does not guarantee strong velocity per store.
International revenue adds more variables. Local food habits, labeling rules, distributor economics, and currency effects can alter reported results without revealing much about U.S. household demand.
Channel mix explains where sales move. Product formulation explains what shoppers and restaurant operators are actually buying.
Where revenue originates matters, yet the products themselves ultimately determine whether those channels sustain demand.
Beyond Burger Anchors a Broader Product Portfolio
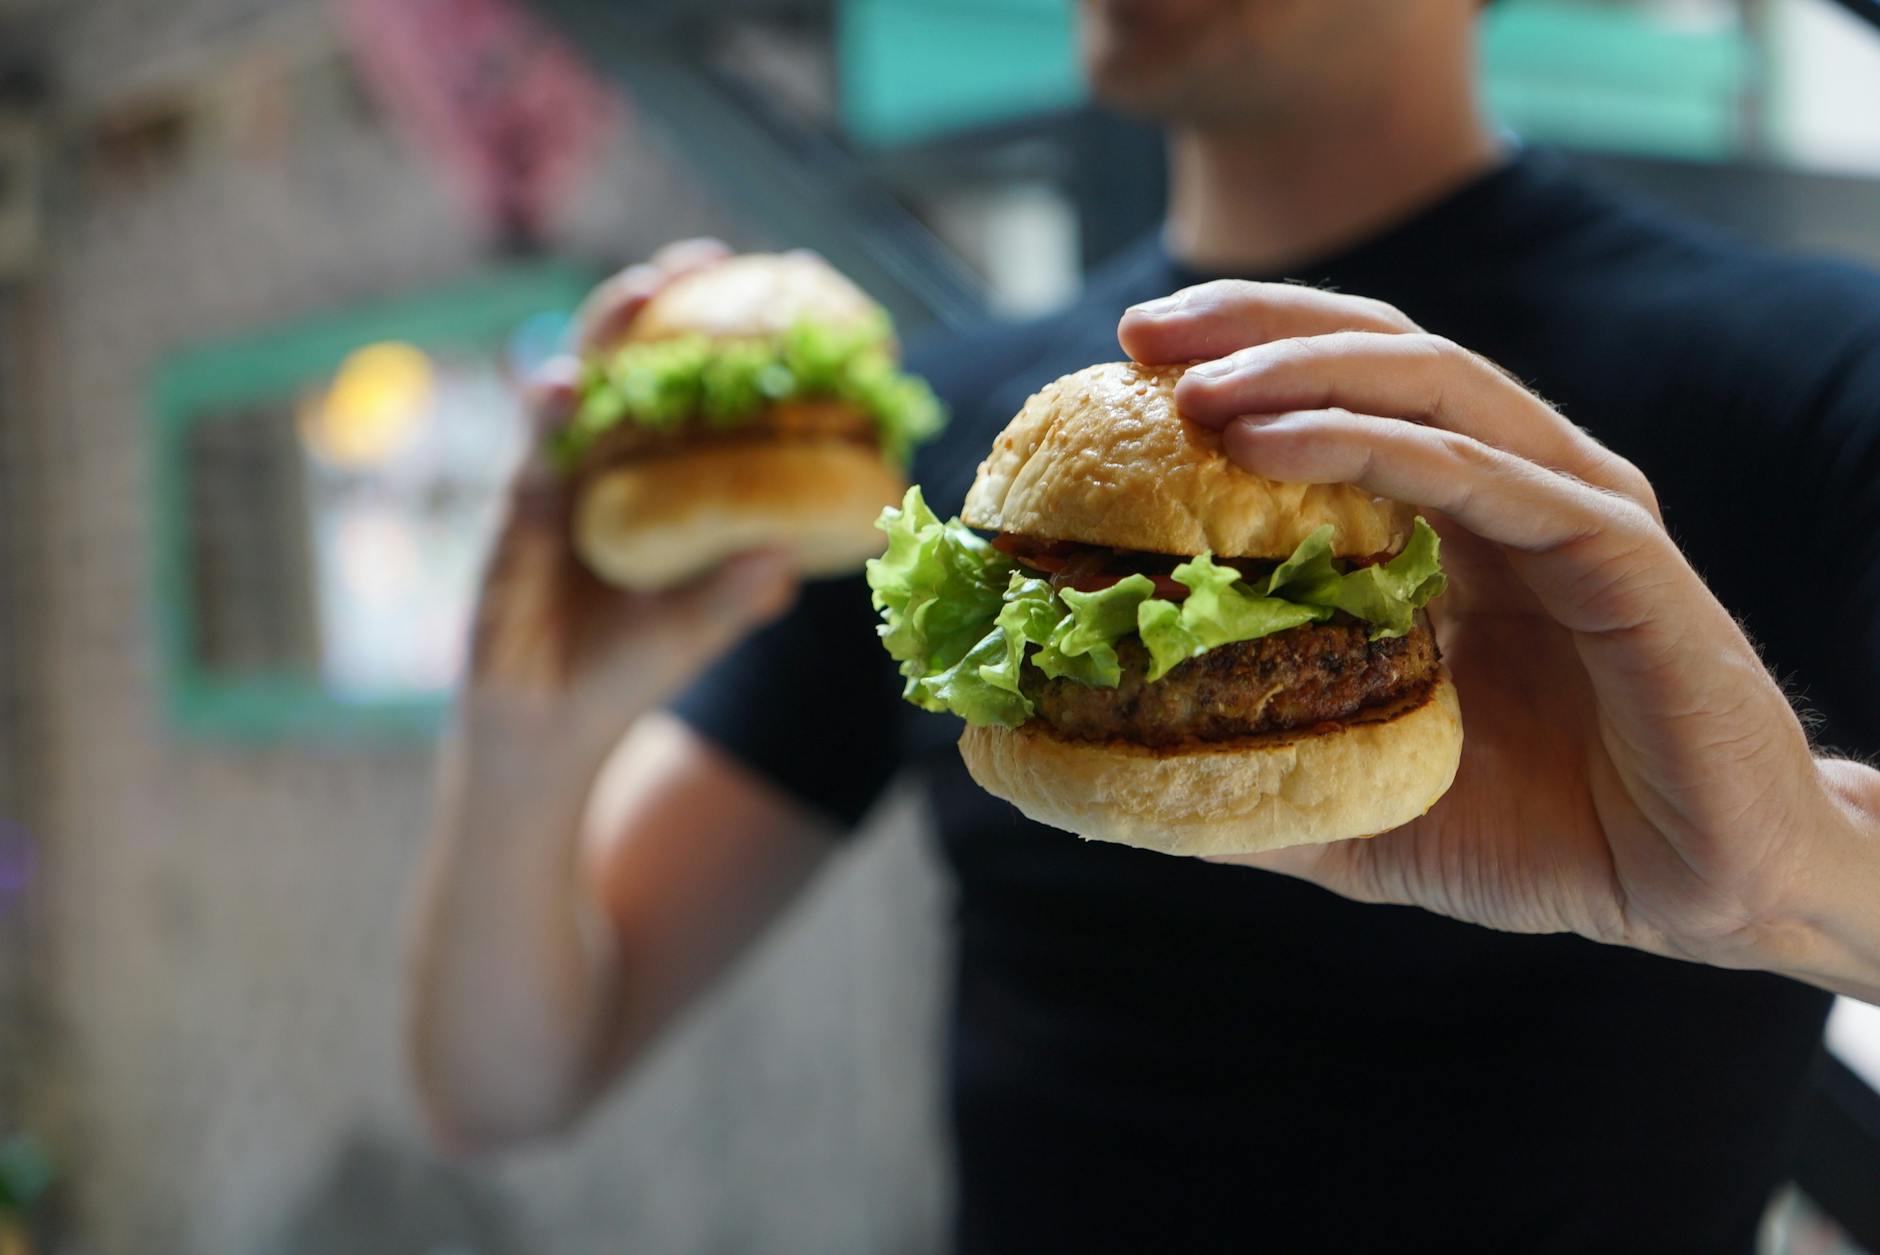
That sales mix rests on recognizable products, led by Beyond Burger. A 4-ounce Beyond Burger patty in certain U.S. formulations contains about 20 grams of protein, a level comparable with many conventional burger portions.
The package label remains the controlling source. Your specific patty may differ by formula, patty size, country, retailer, or foodservice version, so a web image from an older product release may not match the product in your cart.
The Product Line Extends Beyond One Patty
Beyond Burger remains the company’s best-known item, but the lineup has also included ground plant-based beef, sausage, breakfast sausage, Beyond Steak, Beyond Chicken, jerky, and foodservice formats. Product availability can shift as Beyond Meat narrows its assortment or changes restaurant partnerships.
Pea protein provides much of the protein structure in several products. During heating, plant proteins unfold and link into networks that hold water and fat, helping create a firmer bite.
Coconut oil and cocoa butter can add juiciness and cooking behavior. Earlier formulas also used beet-derived color to help mimic the red-to-brown change that occurs while a conventional burger cooks.
Nutrition Facts Vary by Formula and Market
| Nutrition item | Certain Beyond Burger versions | What it means for your label check |
|---|---|---|
| Serving size | One 4-ounce patty | Confirm whether the package uses the same patty weight. |
| Protein | About 20 grams | Protein differs across burgers, sausage, steak, and chicken-style products. |
| Calories | About 230 to 250 | Recipe updates can shift calorie totals. |
| Total fat | About 17 to 18 grams | Added oils shape texture and cooking behavior. |
| Saturated fat | About 5 to 6 grams | Coconut oil can contribute a meaningful share. |
| Sodium | About 350 to 390 milligrams | Compare sodium per serving with the rest of your meal. |
Ingredient lists matter as much as headline protein. Beyond Burger formulations may include pea protein, expeller-pressed canola oil, refined coconut oil, rice protein, methylcellulose, potato starch, natural flavors, salt, and minerals.
Methylcellulose is a plant-derived cellulose ingredient that gels under heat. That function helps a patty hold together on a grill or skillet instead of breaking apart as the interior warms.
Use the package in hand rather than an older web image. Beyond Meat has revised formulas, and nutrition facts may differ among the United States, Canada, Europe, and foodservice products.
The products shaped the IPO story. Public-market attention later shifted toward losses, debt, dilution, and the cost of financing the business.
That product promise attracted early investors, but financing realities gradually became harder for markets to overlook.
BYND Stock Performance Has Moved Away From the IPO Narrative
That financial shift explains why BYND stock performance has diverged from the company’s early brand momentum. BYND closed at $65.75 on its first trading day in May 2019 after an IPO price of $25, then later became highly volatile as growth slowed and losses widened.
The share price exceeded $200 during July 2019’s post-IPO surge. Investors were then focused on category expansion, restaurant partnerships, and short interest rather than the later financial pressure created by falling revenue and recurring net losses.
Dated Price Markers Show the Shift
| Date or period | BYND share-price context | Operating backdrop |
|---|---|---|
| May 2019 IPO | $25 IPO price and $65.75 opening-day close | Rapid growth expectations and new restaurant partnerships |
| July 2019 | Share price exceeded $200 during the post-IPO surge | Investors focused on category expansion and short interest |
| 2020 | Large swings during pandemic retail demand | Revenue reached about $406.8 million |
| 2022 | Major decline from prior highs | Negative gross margin and a $366.1 million net loss |
| 2024 | Shares remained far below IPO-era highs | Revenue fell again, though gross margin turned positive |
A dated chart from Nasdaq, Yahoo Finance, or another market-data provider gives you a more useful view than a single all-time high. A multi-year chart shows the gap between the original growth thesis and the company’s later operating results.
Losses Limit Common Valuation Measures
Price-to-earnings ratios have little use while net income remains negative. Market capitalization measures the equity market value, while enterprise value adds debt and subtracts cash to provide a broader view of the value assigned to operations.
Current market capitalization changes with BYND’s share price and shares outstanding, so it is not a fixed annual-report number. You can calculate it by multiplying the current share price by the current number of shares outstanding, then compare it with revenue, debt, cash, and operating losses.
Price-to-sales ratios remain calculable, but they need context. A low revenue multiple can reflect weak demand, future dilution risk, debt obligations, or doubt that gross margins will recover.
Beyond Meat has used convertible debt and equity issuance as part of its capital structure. Convertible notes can become shares under stated conditions, which may dilute existing holders and increase the importance of liquidity analysis.
Valuation depends on whether the business can improve. The next comparison shows why Beyond Meat faces rivals with deeper resources and broader product portfolios.
Even a turnaround must contend with competitors whose scale, distribution, and budgets reshape the available opportunity.
Beyond Meat Competes Against Larger Food Brands and Private Labels
That financing pressure matters because brand recognition does not equal category control. Beyond Meat remains one of the best-known dedicated plant-based meat brands in the United States, but it operates beside Impossible Foods, large packaged-food companies, private-label products, and conventional meat producers.
The broader choice set is larger than the plant-based meat aisle. Beef, chicken, pork, tofu, tempeh, beans, and blended meat products can all compete for the same dinner occasion and the same household food budget.
Scale Differs Across Major Brand Types
| Company or product group | Brand and distribution position | Resource base |
|---|---|---|
| Beyond Meat | Strong burger recognition, retail presence, and foodservice formats | Dedicated public company with recurring losses and financing needs |
| Impossible Foods | Restaurant visibility and grocery distribution, especially burger formats | Privately held company with separate funding and disclosure practices |
| MorningStar Farms | Longstanding frozen retail presence across meatless foods | Backed by Kellanova, a large packaged-food parent |
| Gardein | Broad frozen plant-based lineup with retail distribution | Backed by Conagra Brands |
| Private-label products | Retailer-controlled placement and lower marketing needs | May benefit from grocery-chain purchasing power |
Plant-based meat market share figures need careful definitions. Statista, Circana, SPINS, and retailer data sets may use different product categories, store panels, countries, and reporting periods.
A category-share estimate is not Beyond Meat, Inc. revenue. Your analysis should separate plant-based meat market share from company revenue because market-share data may exclude foodservice, include private labels differently, or cover only selected retail stores.
A Beyond Burger can appeal on taste, protein, or convenience. Another household may choose tofu, beans, a lower-priced private-label product, or conventional meat based on price, cooking habits, and ingredient preferences.
That wide substitution set helps explain why demand softened after the initial trial phase. Repeat purchase, price perception, and product experience now matter more than novelty alone.
As alternatives multiply, retaining buyers depends increasingly on value, taste, and the capacity to fund operations.
Demand, Costs, and Liquidity Will Determine Future Results
Because repeat purchase now carries more weight, demand depends on more than distribution. A household may try a refrigerated plant-based burger during a promotion, then leave the category when the regular shelf price feels too far above ground beef, chicken, beans, or tofu.
Price sensitivity affects volume, and lower volume can affect factory costs. That link helps explain why Beyond Meat statistics should be read as a connected set of demand, production, and financing measures rather than as isolated revenue figures.
Consumer Demand Depends on Repeat Purchase
Health perception is more complicated than a simple plant-versus-animal label. Some shoppers value protein from peas and other plants, while others focus on sodium, saturated fat, added oils, or the level of processing.
Food processing concerns also have a technical basis. Extrusion uses heat, pressure, moisture, and mechanical shear to align plant proteins into fibrous structures that can create a meat-like chew.
The result is a formulated food rather than a whole-food ingredient such as beans or lentils. Your food choice may still fit your diet, but personal nutrition preferences and a company’s revenue trend do not always move together.
Turnaround Indicators Need to Improve Together
- Retail velocity: Watch revenue per store or pound movement rather than only the number of stores carrying the brand.
- Foodservice retention: Track retained menu placements, repeat orders, and broad chain rollouts instead of short pilots.
- International demand: Look for sustained distributor demand rather than one quarter lifted by shipment timing.
- Gross-margin recovery: Check whether margin gains persist after inventory charges and factory underuse decline.
- Operating expenses: Lower selling, general, and administrative spending can reduce the revenue level needed for profitability.
- Cash consumption: Review operating cash flow, cash balances, debt maturities, and potential future share issuance.
Separate company guidance from reported results. Guidance reflects management expectations, while filed revenue, gross margin, debt, and cash-flow figures record what has already happened.
Peak-era numbers from 2019 through 2021 still appear in search results. You should not use those figures as a stand-alone description of the current operating base because fiscal 2024 revenue was $326.5 million, not the $464.7 million recorded in 2021.
Use the annual Form 10-K and quarterly Form 10-Q for reported figures, then place market-data estimates in a separate column. Mixing estimates with filed data can distort your view of Beyond Meat earnings and net loss.
Beyond IV platform development may also affect the operating story. Product reformulations and platform changes can influence taste, ingredient perception, production costs, and retail or restaurant adoption, though their financial effect depends on repeat demand and scale.
Those indicators lead to a simpler conclusion. The brand still matters, but the business now depends on whether operational improvement can translate into durable demand and lower financing pressure.
Ultimately, those pressures narrow the question to whether the company can convert brand recognition into sustainable economics.
The Bottom Line Is a Test of Demand and Profitability
Beyond Meat is no longer valued mainly as a fast-growth IPO story. The key measures are whether revenue stabilizes, gross margin remains positive, foodservice demand holds, and cash use falls enough to reduce financing pressure.
The company still has a recognized brand, broad product reach, and high-profile examples such as Beyond Burger and McDonald’s McPlant. But recurring operating losses and net losses show that distribution alone has not produced a durable profit model.
Your most useful checklist is straightforward: compare current net revenue with 2021’s $464.7 million peak, inspect gross margin beside volume, track cash and debt, and distinguish retained restaurant programs from limited tests. Those details provide a more grounded view than IPO-era headlines or a single stock-price chart.
FAQ
The figures below answer the most common financial, market, and product questions using the reported annual data and operating context above.
What are Beyond Meat’s latest annual revenue, net loss, and gross margin figures?
Beyond Meat reported fiscal 2024 net revenue of about $326.5 million, a net loss of about
FAQ
60.9 million, and a gross margin of 12.8%. You should separate the positive gross margin from the net loss because corporate and financing costs remained well above the gross profit generated by product sales.How has Beyond Meat’s revenue changed since its peak years?
Beyond Meat reached peak annual net revenue of about $464.7 million in fiscal 2021. Revenue then fell to $418.9 million in 2022, $343.4 million in 2023, and $326.5 million in 2024, leaving 2024 revenue about
FAQ
38.2 million below the 2021 high.What percentage of Beyond Meat sales comes from U.S. retail, foodservice, and international markets?
Beyond Meat sells through the U.S. retail channel, the U.S. foodservice channel, and international revenue channels, but the company does not always disclose a complete percentage breakdown for each route in enough detail to calculate a clean current split. Your review should use the channel figures disclosed in the relevant quarterly release or annual filing rather than assume that each route contributes equally.
What is Beyond Meat’s current market capitalization, stock performance, and valuation profile?
BYND’s share price and shares outstanding determine its market capitalization, requiring a live market-data source for calculation. BYND priced at
The figures below answer the most common financial, market, and product questions using the reported annual data and operating context above.
What are Beyond Meat’s latest annual revenue, net loss, and gross margin figures?
Beyond Meat reported fiscal 2024 net revenue of about $326.5 million, a net loss of about $160.9 million, and a gross margin of 12.8%. You should separate the positive gross margin from the net loss because corporate and financing costs remained well above the gross profit generated by product sales.
How has Beyond Meat’s revenue changed since its peak years?
Beyond Meat reached peak annual net revenue of about $464.7 million in fiscal 2021. Revenue then fell to $418.9 million in 2022, $343.4 million in 2023, and $326.5 million in 2024, leaving 2024 revenue about $138.2 million below the 2021 high.
What percentage of Beyond Meat sales comes from U.S. retail, foodservice, and international markets?
Beyond Meat sells through the U.S. retail channel, the U.S. foodservice channel, and international revenue channels, but the company does not always disclose a complete percentage breakdown for each route in enough detail to calculate a clean current split. Your review should use the channel figures disclosed in the relevant quarterly release or annual filing rather than assume that each route contributes equally.
What is Beyond Meat’s current market capitalization, stock performance, and valuation profile?
BYND’s share price and shares outstanding determine its market capitalization, requiring a live market-data source for calculation. BYND priced at $25 in May 2019 and closed its first trading day at $65.75, later exceeding $200 in July 2019 before falling far below IPO-era highs as revenue weakened and losses continued.
Why has demand for plant-based meat products slowed?
At the grocery shelf, repeat purchases depend on taste, cooking experience, ingredient perception, promotions, and price gaps with meat and other substitutes. Your household may try a product during a promotion, but regular-price repeat demand determines whether retail velocity remains strong.
Who are Beyond Meat’s major competitors in the plant-based protein market?
Impossible Foods, MorningStar Farms, Gardein, grocery private labels, and conventional food companies compete in plant-based protein. You should also recognize that tofu, tempeh, beans, beef, chicken, and pork compete for the same meal occasion even though they are not all direct plant-based meat brands.
What products and restaurant partnerships drive Beyond Meat’s brand awareness?
Beyond Burger remains Beyond Meat’s best-known product, while the portfolio has also included ground plant-based beef, sausage, breakfast sausage, Beyond Steak, Beyond Chicken, jerky, and foodservice formats. McDonald’s McPlant trial activity increased restaurant visibility, but a limited test does not create lasting revenue unless locations retain the item and diners reorder it.
What financial and operational risks does Beyond Meat face?
Beyond Meat faces lower unit volume, promotional spending, weak retail velocity, foodservice order volatility, factory underuse, inventory write-downs, recurring net losses, debt obligations, and potential dilution from convertible notes or equity issuance. You should track gross margin, operating cash flow, debt maturities, and menu retention together because one improving measure does not remove the others.
What is Beyond Meat’s revenue by year?
Annual net revenue reached about $406 million in the reported year.8 million in fiscal 2020, $464.7 million in 2021, $418.9 million in 2022, $343.4 million in 2023, and $326.5 million in 2024. You should use the company’s annual filings for the reporting period attached to each figure.
Is Beyond Meat profitable?
No. Beyond Meat has reported recurring annual net losses in recent years, including a net loss of about $338.8 million in fiscal 2023 and $160.9 million in fiscal 2024. You can see margin improvement in 2024, but positive gross margin is different from companywide profitability.
Why has Beyond Meat’s revenue declined?
Lower sales volumes, softer demand, changing foodservice orders, promotional activity, and consumer price sensitivity have reduced sales. Your review should separate grocery, restaurant, and international performance because weakness in one route can mask strength or weakness in another.
How does Beyond Meat make money?
Beyond Meat earns revenue by selling plant-based burgers, ground beef, sausage, steak, chicken-style products, and foodservice formats through grocery retailers, restaurants, distributors, and international partners. You can trace the company’s revenue through U.S. retail, U.S. foodservice, and international sales channels.
How has Beyond Meat stock performed compared with its financial results?
BYND surged after its May 2019 Nasdaq IPO, then declined sharply from its IPO-era highs as revenue weakened and losses continued. You should view share-price movement beside gross margin, debt, cash balances, operating losses, and dilution risk rather than treating a chart as a stand-alone business measure.
Which countries sell Beyond Meat products?
Beyond Meat has sold products in the United States, Canada, the United Kingdom, parts of Europe, and selected Asia-Pacific markets through retailers, restaurants, and distributors. Availability can change by country, product format, restaurant partnership, and local distributor relationship, so your local store list may differ.
. { “@type”: “Question”. “name”: “How has Beyond Meat’s revenue changed since its peak years?”. “acceptedAnswer”: { “@type”: “Answer”. “text”: “Beyond Meat reached peak annual net revenue of about $464.7 million in fiscal 2021. Revenue then fell to $418.9 million in 2022, $343.4 million in 2023, and $326.5 million in 2024, leaving 2024 revenue about $138.2 million below the 2021 high.” } }. { “@type”: “Question”. “name”: “What percentage of Beyond Meat sales comes from U.S. retail, foodservice, and international markets?”. “acceptedAnswer”: { “@type”: “Answer”. “text”: “Beyond Meat sells through the U.S. retail channel, the U.S. foodservice channel, and international revenue channels, but the company does not always disclose a complete percentage breakdown for each route in enough detail to calculate a clean current split. Your review should use the channel figures disclosed in the relevant quarterly release or annual filing rather than assume that each route contributes equally.” } }. { “@type”: “Question”. “name”: “What is Beyond Meat’s current market capitalization, stock performance, and valuation profile?”. “acceptedAnswer”: { “@type”: “Answer”. “text”: “Beyond Meat’s current market capitalization changes with BYND’s share price and shares outstanding, so you need a live market-data source to calculate it. BYND priced at $25 in May 2019 and closed its first trading day at $65.75, later exceeding $200 in July 2019 before falling far below IPO-era highs as revenue weakened and losses continued.” } }. { “@type”: “Question”. “name”: “Why has demand for plant-based meat products slowed?”. “acceptedAnswer”: { “@type”: “Answer”. “text”: “Demand has slowed because repeat purchases depend on taste, cooking experience, ingredient perception, promotions, and the price gap between plant-based meat and beef, chicken, tofu, beans, or other substitutes. Your household may try a product during a promotion, but regular-price repeat demand determines whether retail velocity remains strong.” } }. { “@type”: “Question”. “name”: “Who are Beyond5 in May 2019 and closed its first trading day at $65.75, later exceedingThe figures below answer the most common financial, market, and product questions using the reported annual data and operating context above.
What are Beyond Meat’s latest annual revenue, net loss, and gross margin figures?
Beyond Meat reported fiscal 2024 net revenue of about $326.5 million, a net loss of about $160.9 million, and a gross margin of 12.8%. You should separate the positive gross margin from the net loss because corporate and financing costs remained well above the gross profit generated by product sales.
How has Beyond Meat’s revenue changed since its peak years?
Beyond Meat reached peak annual net revenue of about $464.7 million in fiscal 2021. Revenue then fell to $418.9 million in 2022, $343.4 million in 2023, and $326.5 million in 2024, leaving 2024 revenue about $138.2 million below the 2021 high.
What percentage of Beyond Meat sales comes from U.S. retail, foodservice, and international markets?
Beyond Meat sells through the U.S. retail channel, the U.S. foodservice channel, and international revenue channels, but the company does not always disclose a complete percentage breakdown for each route in enough detail to calculate a clean current split. Your review should use the channel figures disclosed in the relevant quarterly release or annual filing rather than assume that each route contributes equally.
What is Beyond Meat’s current market capitalization, stock performance, and valuation profile?
BYND’s share price and shares outstanding determine its market capitalization, requiring a live market-data source for calculation. BYND priced at $25 in May 2019 and closed its first trading day at $65.75, later exceeding $200 in July 2019 before falling far below IPO-era highs as revenue weakened and losses continued.
Why has demand for plant-based meat products slowed?
At the grocery shelf, repeat purchases depend on taste, cooking experience, ingredient perception, promotions, and price gaps with meat and other substitutes. Your household may try a product during a promotion, but regular-price repeat demand determines whether retail velocity remains strong.
Who are Beyond Meat’s major competitors in the plant-based protein market?
Impossible Foods, MorningStar Farms, Gardein, grocery private labels, and conventional food companies compete in plant-based protein. You should also recognize that tofu, tempeh, beans, beef, chicken, and pork compete for the same meal occasion even though they are not all direct plant-based meat brands.
What products and restaurant partnerships drive Beyond Meat’s brand awareness?
Beyond Burger remains Beyond Meat’s best-known product, while the portfolio has also included ground plant-based beef, sausage, breakfast sausage, Beyond Steak, Beyond Chicken, jerky, and foodservice formats. McDonald’s McPlant trial activity increased restaurant visibility, but a limited test does not create lasting revenue unless locations retain the item and diners reorder it.
What financial and operational risks does Beyond Meat face?
Beyond Meat faces lower unit volume, promotional spending, weak retail velocity, foodservice order volatility, factory underuse, inventory write-downs, recurring net losses, debt obligations, and potential dilution from convertible notes or equity issuance. You should track gross margin, operating cash flow, debt maturities, and menu retention together because one improving measure does not remove the others.
What is Beyond Meat’s revenue by year?
Annual net revenue reached about $406 million in the reported year.8 million in fiscal 2020, $464.7 million in 2021, $418.9 million in 2022, $343.4 million in 2023, and $326.5 million in 2024. You should use the company’s annual filings for the reporting period attached to each figure.
Is Beyond Meat profitable?
No. Beyond Meat has reported recurring annual net losses in recent years, including a net loss of about $338.8 million in fiscal 2023 and $160.9 million in fiscal 2024. You can see margin improvement in 2024, but positive gross margin is different from companywide profitability.
Why has Beyond Meat’s revenue declined?
Lower sales volumes, softer demand, changing foodservice orders, promotional activity, and consumer price sensitivity have reduced sales. Your review should separate grocery, restaurant, and international performance because weakness in one route can mask strength or weakness in another.
How does Beyond Meat make money?
Beyond Meat earns revenue by selling plant-based burgers, ground beef, sausage, steak, chicken-style products, and foodservice formats through grocery retailers, restaurants, distributors, and international partners. You can trace the company’s revenue through U.S. retail, U.S. foodservice, and international sales channels.
How has Beyond Meat stock performed compared with its financial results?
BYND surged after its May 2019 Nasdaq IPO, then declined sharply from its IPO-era highs as revenue weakened and losses continued. You should view share-price movement beside gross margin, debt, cash balances, operating losses, and dilution risk rather than treating a chart as a stand-alone business measure.
Which countries sell Beyond Meat products?
Beyond Meat has sold products in the United States, Canada, the United Kingdom, parts of Europe, and selected Asia-Pacific markets through retailers, restaurants, and distributors. Availability can change by country, product format, restaurant partnership, and local distributor relationship, so your local store list may differ.
. { “@type”: “Question”. “name”: “How has Beyond Meat’s revenue changed since its peak years?”. “acceptedAnswer”: { “@type”: “Answer”. “text”: “Beyond Meat reached peak annual net revenue of about $464.7 million in fiscal 2021. Revenue then fell to $418.9 million in 2022, $343.4 million in 2023, and $326.5 million in 2024, leaving 2024 revenue about $138.2 million below the 2021 high.” } }. { “@type”: “Question”. “name”: “What percentage of Beyond Meat sales comes from U.S. retail, foodservice, and international markets?”. “acceptedAnswer”: { “@type”: “Answer”. “text”: “Beyond Meat sells through the U.S. retail channel, the U.S. foodservice channel, and international revenue channels, but the company does not always disclose a complete percentage breakdown for each route in enough detail to calculate a clean current split. Your review should use the channel figures disclosed in the relevant quarterly release or annual filing rather than assume that each route contributes equally.” } }. { “@type”: “Question”. “name”: “What is Beyond Meat’s current market capitalization, stock performance, and valuation profile?”. “acceptedAnswer”: { “@type”: “Answer”. “text”: “Beyond Meat’s current market capitalization changes with BYND’s share price and shares outstanding, so you need a live market-data source to calculate it. BYND priced at $25 in May 2019 and closed its first trading day at $65.75, later exceeding $200 in July 2019 before falling far below IPO-era highs as revenue weakened and losses continued.” } }. { “@type”: “Question”. “name”: “Why has demand for plant-based meat products slowed?”. “acceptedAnswer”: { “@type”: “Answer”. “text”: “Demand has slowed because repeat purchases depend on taste, cooking experience, ingredient perception, promotions, and the price gap between plant-based meat and beef, chicken, tofu, beans, or other substitutes. Your household may try a product during a promotion, but regular-price repeat demand determines whether retail velocity remains strong.” } }. { “@type”: “Question”. “name”: “Who are Beyond00 in July 2019 before falling far below IPO-era highs as revenue weakened and losses continued.Why has demand for plant-based meat products slowed?
At the grocery shelf, repeat purchases depend on taste, cooking experience, ingredient perception, promotions, and price gaps with meat and other substitutes. Your household may try a product during a promotion, but regular-price repeat demand determines whether retail velocity remains strong.
Who are Beyond Meat’s major competitors in the plant-based protein market?
Impossible Foods, MorningStar Farms, Gardein, grocery private labels, and conventional food companies compete in plant-based protein. You should also recognize that tofu, tempeh, beans, beef, chicken, and pork compete for the same meal occasion even though they are not all direct plant-based meat brands.
